Canadian home sales edge up again in September
Ottawa, ON, October 13, 2017 – According to statistics released today by The Canadian Real Estate Association (CREA), national home sales in September rose modestly from the previous month but remained down from levels recorded one year ago.
Highlights:
- National home sales rose 2.1% from August to September.
- Actual (not seasonally adjusted) activity stood 11% below last September’s level.
- The number of newly listed homes rebounded by 4.9% from August to September.
- The MLS® Home Price Index (HPI) was up 10.7% year-over-year (y-o-y) in September 2017.
- The national average sale price climbed by 2.8% y-o-y in September.
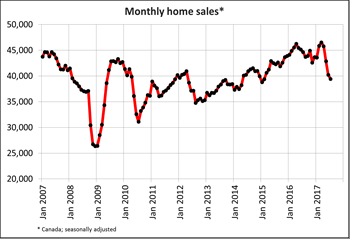
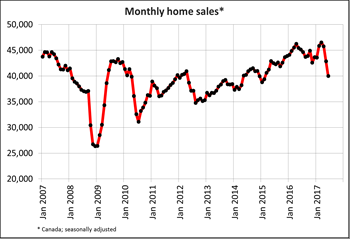
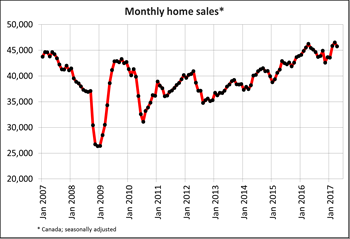
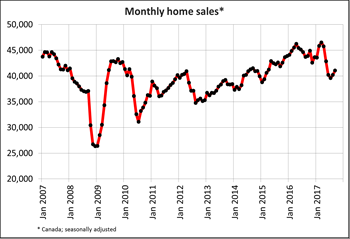
 The number of homes sold via Canadian MLS® Systems edged up 2.1% in September 2017. The small gain builds on an even smaller increase in August, but leaves national home sales almost 12% below the record set in March.
Activity was up between August and September in about half of all local markets, led by Greater Vancouver and Vancouver Island, the Greater Toronto Area (GTA), London and St. Thomas, and Barrie. In and around the Greater Golden Horseshoe region, some markets posted monthly sales gains while activity in others remained near recent lows or fell further.
Actual (not seasonally adjusted) activity was down 11% in September 2017 compared to the record for the month in 2016. Sales were down from year-ago levels in close to three-quarters of all local markets, led by the GTA and nearby housing markets.
“National sales appear to be stabilizing,” said CREA President Andrew Peck. “While encouraging, it’s too early to tell if this is the beginning of a longer-term trend. The national result continues to be influenced heavily by trends in Toronto and Vancouver but housing market conditions vary widely across Canada. All real estate is local, and REALTORS® remain your best source for information about sales and listings where you live or might like to.”
“Further tightening of federal regulations aimed at cooling housing markets in Toronto and Vancouver risks creating collateral damage in markets elsewhere in Canada,” said Gregory Klump, CREA’s Chief Economist. “It also jeopardizes Canadian economic growth, which is already showing signs of fading.”
The number of newly listed homes rebounded by almost 5% in September following three consecutive monthly declines. The national result was largely the result of a jump in new supply in the GTA.
With new listings up by more than sales in September, the national sales-to-new listings ratio eased to 55.7% compared to 57.2% in August. A national sales-to-new listings ratio of between 40% and 60% is generally consistent with balanced national housing market, with readings below and above this range indicating buyers’ and sellers’ markets respectively.
That said, this rule of thumb varies among local markets. Considering the degree and duration that current market balance is above or below its long-term average is a more sophisticated way of gauging whether local housing market conditions favour buyers or sellers. (Market balance measures that are within one standard deviation of the long-term average are generally consistent with balanced market conditions).
Based on a comparison of the sales-to-new listings ratio with its long-term average, about two-thirds of all local markets were in balanced market territory in September 2017.
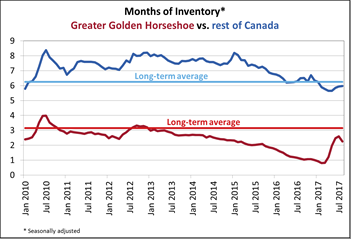
The number of months of inventory is another important measure of the balance between housing supply and demand. It represents how long it would take to liquidate current inventories at the current rate of sales activity.
There were 5 months of inventory on a national basis at the end of September 2017, unchanged from August and broadly in line with the long-term average for the measure.
At 2.4 months, the number of months of inventory in the Greater Golden Horseshoe region is up sharply from the all-time low of 0.8 months reached in February and March. However, it remains below the region’s long-term average of 3.1 months.
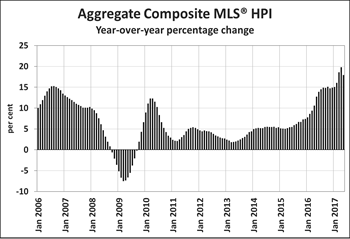
 The Aggregate Composite MLS® HPI rose by 10.7% y-o-y in September 2017, representing a further deceleration in y-o-y gains since April.
The deceleration in price gains largely reflects softening price trends in Greater Golden Horseshoe housing markets tracked by the index.
Price gains diminished in September among the ground-level benchmark homes tracked by the index and accelerated slightly for apartment units.
Apartment units again posted the largest y-o-y gains in September (+19.8%), followed by townhouse/row units (+13.5%), one-storey single family homes (+7.9%), and two-storey single family homes (+7.2%).
While price trends continue to vary widely by region, benchmark home prices were up from year-ago levels in all 13 markets tracked by the MLS® HPI – something that has not happened in close to seven years.
After having dipped in the second half of last year, benchmark home prices in the Lower Mainland of British Columbia have recovered and now stand at new highs (Greater Vancouver: +10.9% y-o-y; Fraser Valley: +16.2% y-o-y).
Benchmark home price increases have slowed to about 15% on a y-o-y basis in Victoria, while still running at about 20% elsewhere on Vancouver Island.
Price gains slowed further on a y-o-y basis in Greater Toronto, Oakville-Milton and Guelph; however, prices in those markets remain well above year-ago levels (Greater Toronto: +12.2% y-o-y; Oakville-Milton: +8.8% y-o-y; Guelph: +17.3% y-o-y).
Calgary benchmark prices remained just inside positive territory on a y-o-y basis in September (+0.6%). Meanwhile, home prices accelerated on a y-o-y basis in Regina (+7.7% y-o-y) and turned positive in Saskatoon, posting their first y-o-y gain since mid-2015.
Benchmark home price growth accelerated in Ottawa (+6.2% y-o-y overall, led by a 7.2% increase in one-storey single family home prices), Greater Montreal (+5.1% y-o-y overall, led by an 8.3% increase in prices for townhouse/row units), and Greater Moncton (+5.4% y-o-y overall, led by a 7.2% increase in one-storey single family home prices).
For Ottawa and Greater Montreal, the September 2017 y-o-y price gains were the largest since November 2010 and May 2011 respectively.
The MLS® Home Price Index (MLS® HPI) provides the best way of gauging price trends because average price trends are prone to being strongly distorted by changes in the mix of sales activity from one month to the next.
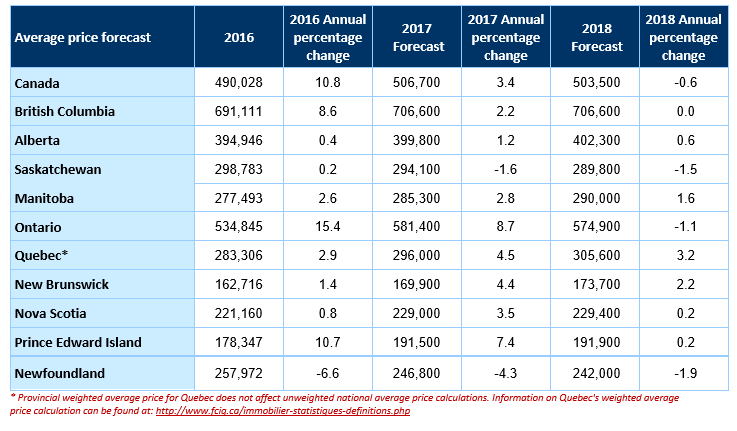
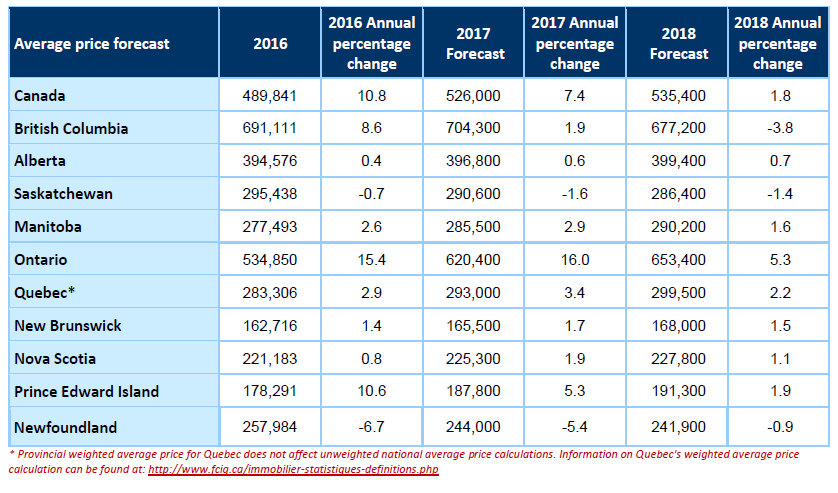
The actual (not seasonally adjusted) national average price for homes sold in September 2017 was just over $487,000, up almost 3% from one year ago. The national average price is heavily skewed by sales in Greater Vancouver and Greater Toronto, two of Canada’s most active and expensive markets. Excluding these two markets from calculations trims more than $110,000 from the national average price (to just above $374,500).
– 30 –
PLEASE NOTE: The information contained in this news release combines both major market and national sales information from MLS® Systems from the previous month.
CREA cautions that average price information can be useful in establishing trends over time, but does not indicate actual prices in centres comprised of widely divergent neighbourhoods or account for price differential between geographic areas. Statistical information contained in this report includes all housing types.
MLS® Systems are co-operative marketing systems used only by Canada’s real estate Boards to ensure maximum exposure of properties listed for sale.
The Canadian Real Estate Association (CREA) is one of Canada’s largest single-industry trade associations, representing more than 120,000 REALTORS® working through some 90 real estate Boards and Associations.
Further information can be found at http://crea.ca/statistics.
For more information, please contact:
Pierre Leduc, Media Relations
The Canadian Real Estate Association
Tel.: 613-237-7111 or 613-884-1460