Canadian home sales fall further in February
Ottawa, ON, March 15, 2018 – Statistics released today by The Canadian Real Estate Association (CREA) show national home sales declined further in February 2018.
Highlights:
- National home sales declined by 6.5% from January to February.
- Actual (not seasonally adjusted) activity was down 16.9% year-over-year (y-o-y) in February.
- The number of newly listed homes recovered by 8.1% from January to February.
- The MLS® Home Price Index (HPI) in February was up 6.9% y-o-y.
- The national average sale price declined by 5% y-o-y in February.
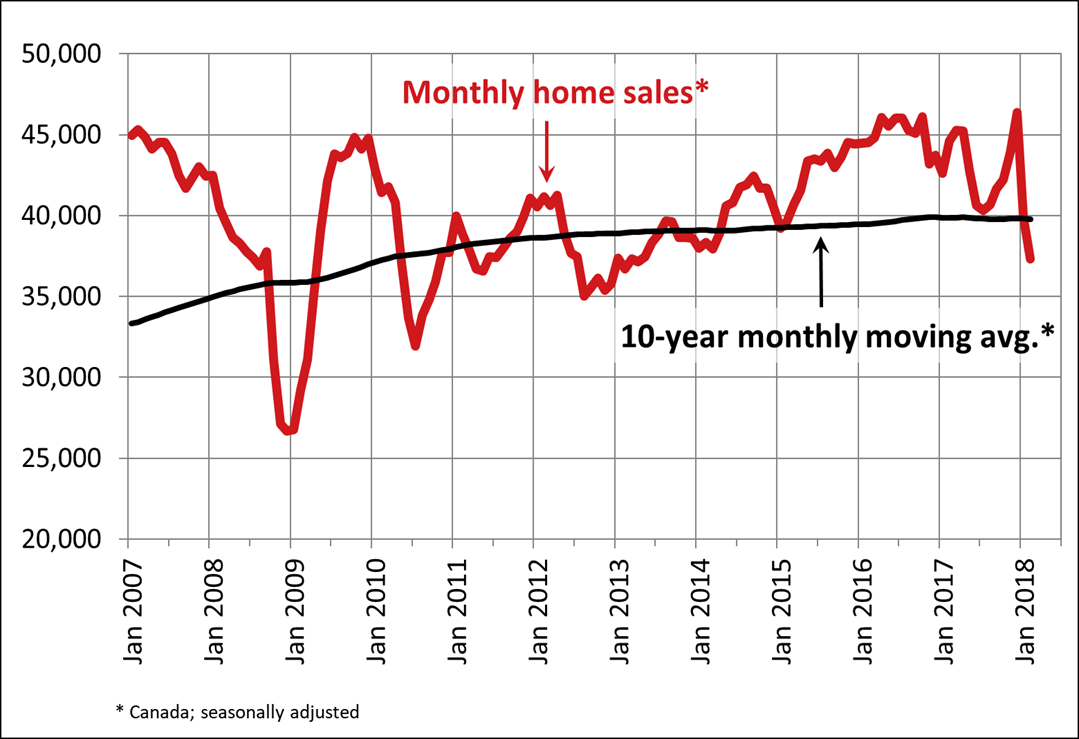
Home sales via Canadian MLS® Systems were down 6.5% in February. This marks the second consecutive monthly decline following the record set in December 2017 and the lowest reading in nearly five years.
February sales were down from the previous month in almost three-quarters of all local housing markets, with large monthly declines in and around Greater Vancouver (GVA) and Greater Toronto (GTA).
Actual (not seasonally adjusted) activity was down 16.9% year-over-year (y-o-y) and hit
a five-year low for the month of February. Sales also stood 7% below the 10-year average for the month of February. Sales activity came in below year-ago levels in 80% of all local markets in February, including those nearby and within Ontario’s Greater Golden Horseshoe (GGH) region.
“Sales activity is down in many, but not all, housing markets compared to the end of last year, and varies depending on price range, location and property type,” said CREA President Andrew Peck. “All real estate is local,” he added. “A professional REALTOR® is your best source for information and guidance in negotiations to purchase or sell a home during these changing times,” said Peck.
“The drop off in sales activity following the record-breaking peak late last year confirms that many homebuyers moved purchase decisions forward late last year before tighter mortgage rules took effect in January,” said Gregory Klump, CREA’s Chief Economist. “Momentum for home sales activity going into the second quarter is also likely to weighed down by housing market uncertainty in British Columbia, where new housing polices were introduced toward the end of February.”
The number of newly listed homes recovered by 8.1% in February following a plunge of more than 20% in January. Despite the monthly increase in February, new listings nationally were still lower than monthly levels recorded in every month last year except January, and came in 6.4% below the 10-year monthly average and 14.6% below the peak reached in December 2017.
New supply was up in about three-quarters of local markets. The monthly increase was led by B.C.’s Lower Mainland, the GTA, Ottawa and Montreal; despite the monthly rise in new supply, these markets remain balanced or continue to favour sellers.
With sales down and new listings up in February, the national sales-to-new listings ratio eased to 55% compared to 63.7% in January. This returned the ratio close to where it was during the second half of last year.
A national sales-to-new listings ratio of between 40% and 60% is generally consistent with a balanced national housing market, with readings below and above this range indicating buyers’ and sellers’ markets respectively. That said, the balanced range can vary among local markets.
For that reason, considering the degree and duration that market balance is above or below its long-term average is a better way of gauging whether local housing market conditions favour buyers or sellers. Market balance measures that are within one standard deviation of the long-term average are generally consistent with balanced market conditions.
Based on a comparison of the sales-to-new listings ratio with its long-term average, almost three-quarters of all local markets were in balanced market territory in February 2018.
The number of months of inventory is another important measure for the balance between housing supply and demand. It represents how long it would take to liquidate current inventories at the current rate of sales activity.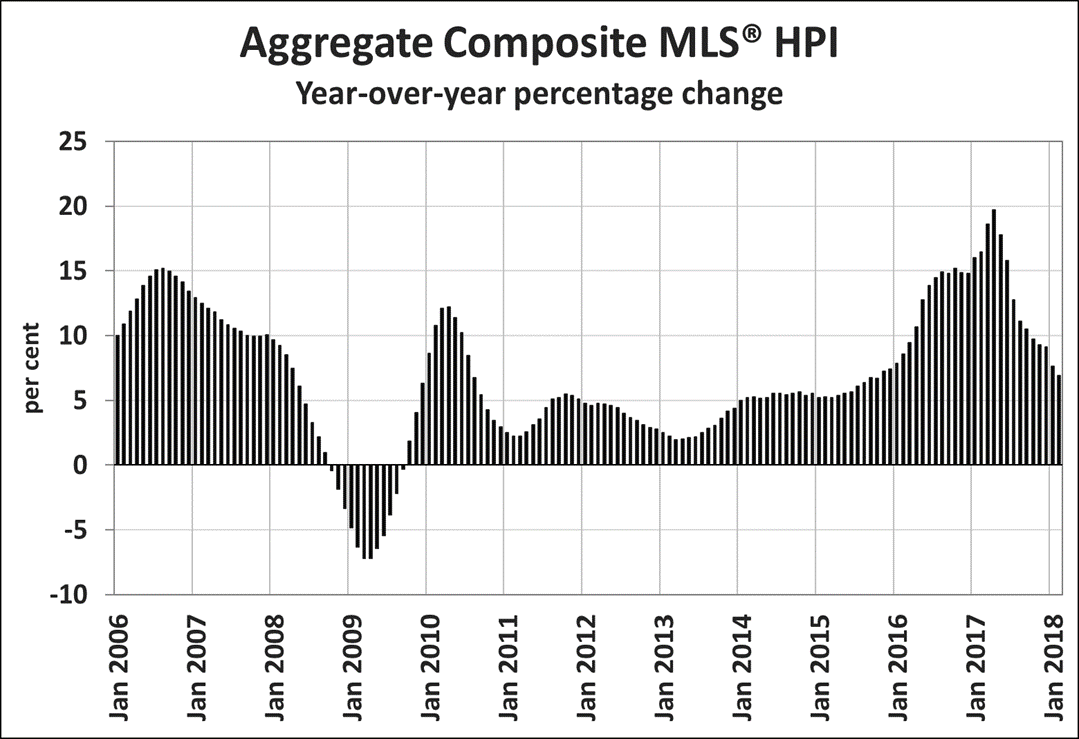
There were 5.3 months of inventory on a national basis at the end of February 2018 – the highest level in two-and-a-half years and in line with the long-term average of 5.2 months.
The Aggregate Composite MLS® HPI rose by 6.9% y-o-y in February 2018. This was the 10th consecutive deceleration in y-o-y gains, continuing a trend that began last spring. It was also the smallest y-o-y increase since October 2015.
Slowing y-o-y home price growth largely reflects trends for GGH housing markets tracked by the index. Prices in the region have stabilized or begun to show tentative signs of moving higher in recent months; however, year-over-year comparisons are likely to continue to deteriorate further due to rapid price gains posted one year ago.
Apartment units again posted the largest y-o-y price gains in February (+20.1%), followed by townhouse/row units (+11.8%), one-storey single family homes (+3.5%), and two-storey single family homes (+1%).
Benchmark home prices in February were up from year-ago levels in 10 of the 13 markets tracked by the MLS® HPI.
Composite benchmark home prices in the Lower Mainland of British Columbia continue to trend higher after having dipped briefly during the second half of 2016 (GVA: +16.9% y-o-y; Fraser Valley: +24.1% y-o-y). Apartment units have been largely driving this regional trend in recent months.
Benchmark home prices continued to rise by about 14% on a y-o-y basis in Victoria and by about 20% elsewhere on Vancouver Island.
Price gains have slowed considerably on a y-o-y basis but remain above year-ago levels in the GTA (+3.2%) and Guelph (+9.3%). While home prices in Oakville-Milton are down slightly from one year ago (-1.9%), the monthly price trends in these markets have begun to show signs of stabilizing or tentative upward movement in recent months.
Calgary benchmark home prices were flat (+0.1%) on a y-o-y basis, while prices in Regina and Saskatoon were down from last February (-4.8% y-o-y and -3.8% y-o-y, respectively).
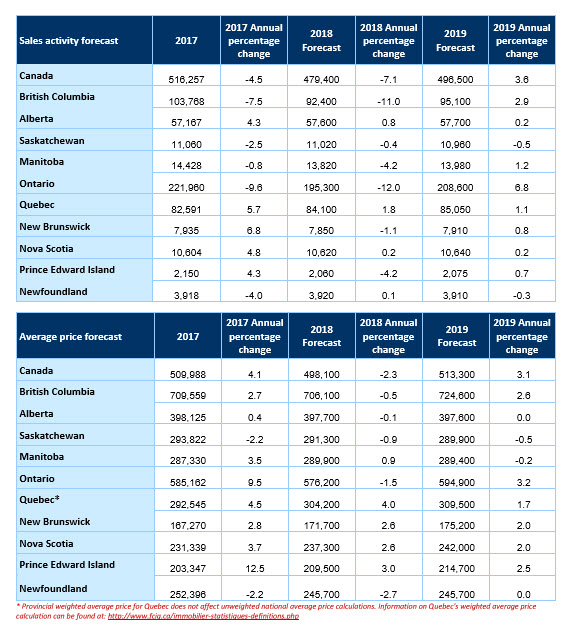
Benchmark home prices rose by 7.7% y-o-y in Ottawa (led by an 8.9% increase in two-storey single family home prices), by 6.1% in Greater Montreal (led by a 8.8% increase in townhouse/row unit prices) and by 5% in Greater Moncton (led by an 6.4% increase in one-storey single family home prices). (Table 1)
The MLS® Home Price Index (MLS® HPI) provides the best way of gauging price trends because average price trends are prone to being strongly distorted by changes in the mix of sales activity from one month to the next.
The actual (not seasonally adjusted) national average price for homes sold in February 2018 was just over $494,000, down 5% from one year earlier. The decline demonstrates the impact of GTA sales activity on the national average price.
The national average price is heavily skewed by sales in the GVA and GTA, two of Canada’s most active and expensive markets. Excluding these two markets from calculations trims more than $112,000 from the national average price, reducing it to just under $382,000.
– 30 –
PLEASE NOTE: The information contained in this news release combines both major market and national sales information from MLS® Systems from the previous month.
CREA cautions that average price information can be useful in establishing trends over time, but does not indicate actual prices in centres comprised of widely divergent neighbourhoods or account for price differential between geographic areas. Statistical information contained in this report includes all housing types.
MLS® Systems are co-operative marketing systems used only by Canada’s real estate Boards to ensure maximum exposure of properties listed for sale.
The Canadian Real Estate Association (CREA) is one of Canada’s largest single-industry trade associations, representing more than 120,000 REALTORS® working through some 90 real estate Boards and Associations.
Further information can be found at http://crea.ca/statistics.
For more information, please contact:
Pierre Leduc, Media Relations
The Canadian Real Estate Association
Tel.: 613-237-7111 or 613-884-1460
E-mail: [email protected]